


Under Construction
Digital pressure gauge
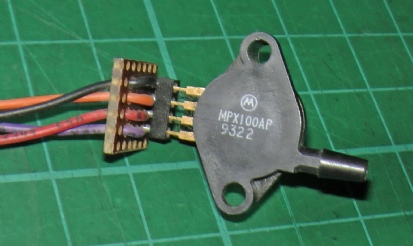
Pressure gauges which output some sort of electrical signal which could be read by a microprocessor seem to be a bit thin on the ground, at least those which are affordable and readily available. The sensor on the left measures small pressures above and below atmospheric and is used, for example, in car ecus to measure manifold pressure. This uses the piezoelectric effect which creates a potential difference on the faces of a quartz crystal when the crystal is distorted.
This type of sensor is quite cheap but, as far as I am aware, not suitable for measuring water at reasonably high pressures.
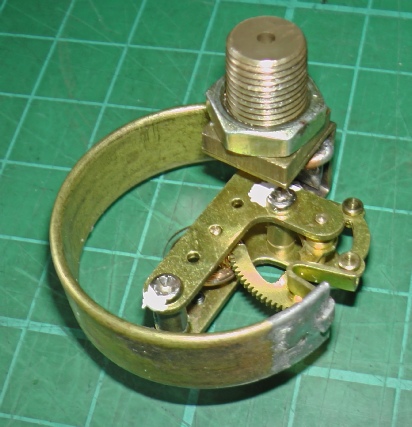
The device on the left is the works from a mechanical pressure gauge known as a Bourdon gauge. The fluid or gas whose pressure is to be measured, is admitted through the pipe union at the top of the picture. It is fed into the flat, curved, tube. The pressure tends to make the tube straighten, the amount of straightening will depend on the pressure. The free end of the tube is linked by a link and a lever to a gear which turns a shaft which would normally have a needle mounted on it.
These devices are very cheap and can be obtained to measure in a great range of pressures, 0 -
There very little force available so an optical method would, perhaps, be best. The next question is what precision of mechanical to electrical conversion will be required? The gauge originally moved a needle over 270 degrees. My guess is that being able to convert this into one electrical step per degree of movement will be quite a bit more than would be justified given the precision and accuracy of the Bourdon gauge. In digital terms this would approximate to 8-
I want to monitor the pressure of the supply to my automatic watering system. Partly so that allowances could be made as the pressure varied and partly to check that pressure was present at all! (My supply is effectively through a long hose to an external tap on the house. This could burst or be disconnected and not be noticed in which case the plants would not get watered!)
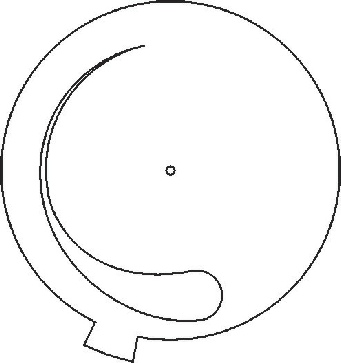
I could use a Gray scale coded optical disc as in my wind direction project but this time I am opting to use an analogue solution which involves a disc with a slot which steadily increases in width round the disc and which allows an amount of light to pass depending on the position of the disc. On one side of the disc will be an LED and on the other a cadmium sulphide photo-
I drew the disc on Corel Draw using the simplest Bezier curves to get the smoothest result I could. I just guessed the rate of decrease of width of the slot. (After all, I will probably have to calibrate the output of the gauge against readings from an existing gauge known to be reasonably accurate anyway.)
I could have traced this onto a thin sheet of aluminium, say, and cut it out using a piercing saw but instead, I decide to use my new Aldi (Balco) 3-
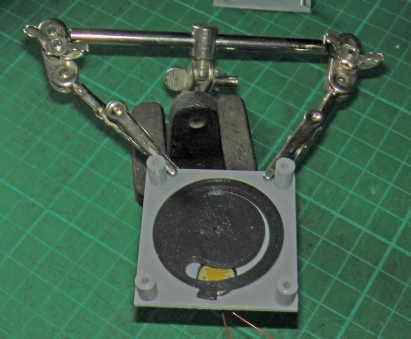
The picture,left, shows the printed out disc with its slot laid over the LDR so that the disc can be manually turned.
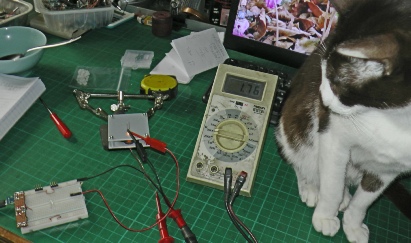
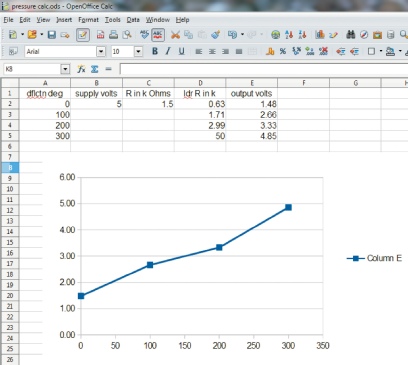
I fitted an LED over the slot and measured the resistance of the LDR as I turned the disc to various positions. I then set up a spreadsheet to predict the output voltage which would result from a supply voltage of 5 volts and various resistances in the other leg of the potential divider. I plotted a graph showing the relationship between the output voltage and the angle of the disc. The cat helped by calling out the values on the multimeter.
The cat has assisted in the past with measurements!
But enough of the whimsy, by a lucky chance the non-
By using a resistance of about 1.5k in the potential divider leg I will also get a good voltage span in the output. This will produce the best precision in conversion to a digital value.
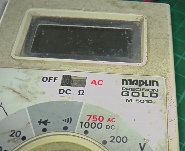
every time I use my meter, I shed a little tear…

By the way,
Also,
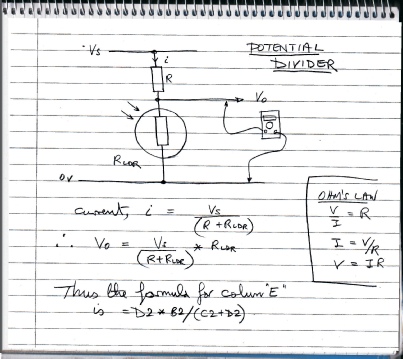
The notes on the left show how a potential divider works.
To convert the output voltage into a digital format, I used an analogue to digital converter chip, the PCF8591, widely available on Ebay for a couple of quid or so, soldered onto a pcb for easy connection. The conversion is 8-
Next: construction.